

When your operations staff need access to time-series based metrics, but the underlying hardware/software system doesn't support SNMP, APIs, etc, what options do you have?
A few weeks ago, I sat in a meeting with my facilities manager and we were discussing the shortcomings of our HVAC system which spans roughly 35 POPs. The discussion led into a budgetary talk about the potential to spend $2,000/location + labor to replace all the HVAC controllers with ethernet enabled controllers or retrofit modbus-tcp relays. As I tore apart the controller, I confirmed that it lacked proper data access tooling, but in general, if you can see it, you can automate it.
The dissection
When visiting the controller users are prompted for a login which appears to be a very simple static HTML page. Once logged in, the system status page has all the alarms, digital status points, and analog status points displayed in a few HTML tables. The HTML tables are updating in real-time which means there must be some Javascript and this page is not simply a static HTML page.
The plan
While time consuming for a human to login and load these pages to get the data by themselves, it isn't difficult. But when you are in a storm scenario, logging into dozens of locations several times throughout the day is simply not scalable or indicative of a modern proactive network. Human being the key word.
My thought is, we could create a Python script which emulates a user logging into the HVAC controllers, then scrapes the HTML for the specific DOM element, and then return that data to the user. If we can have this script run continuously, we can store that data with Zabbix and graph it over time using Grafana.
Pragmatic access to headless browsers
Ideally, Python isn't literally opening browsers and clicking through pages like a screen recorder, that would be ridiculous and take considerably more power and time. We have much greater flexibility interacting with the engines that power the webpage directly. Using the standard library, Python can send HTML data directly to servers and download the response without the browser needing to render the data. This provides you "headless" pragmatic access to the website.
Logging in
Lets browse to HVAC controller login screen and take a look at what is powering the login by right clicking the elements in the browser and selecting "view source"
<form method="post" action="System/index.htm">
   <table>
     <tr>
       <td style="width: 100px;">User: </td>
       <td><input maxlength="20" name="user"></td>
     </tr>
       <br><br>
     <tr>
       <td style="width: 100px;">Password: </td>
       <td><input maxlength="20" name="password" type="password"></td>
     </tr>
   </table>
       <br>
   <input style="margin-left: 250px;" value="Log In" type="submit"><br>
  <br>
  <br>
</form>
When you review the HTML code above, you will see we simply need to provide 2 variables via POST to the endpoint "System/index.htm." In Python, this is straight forward and provided directly in the standard library.
import requests

login_url = "HVAC IP" + "/System/index.htm"

session = requests.Session()
session.get(login_url, timeout=1)

username = "USERNAME"
password = "PASSWORD"

login_data = {
  "user": username,
  "password": password
}

login_response = session.post(login_url, data=login_data, timeout=1)

if (login_response.status_code == 200):
  print("Logged in!")
else:
  print("Log in failed :(")

Finding the data
Similar to many low level hardware devices like electrical RTUs, IEDs, PLCs, etc, the HVAC controller is simply aggregating two main types of data, digital status points (1, 0), and analog status points (0.0002, 0.04443). The digital status points typically indicate whether something is OPEN vs CLOSED or ON vs OFF. Whereas analog status points are measuring some sort of signal like voltage, temperature, etc.
Lets take a look at the data we are trying to get from the HVAC controller by visiting the system status page.
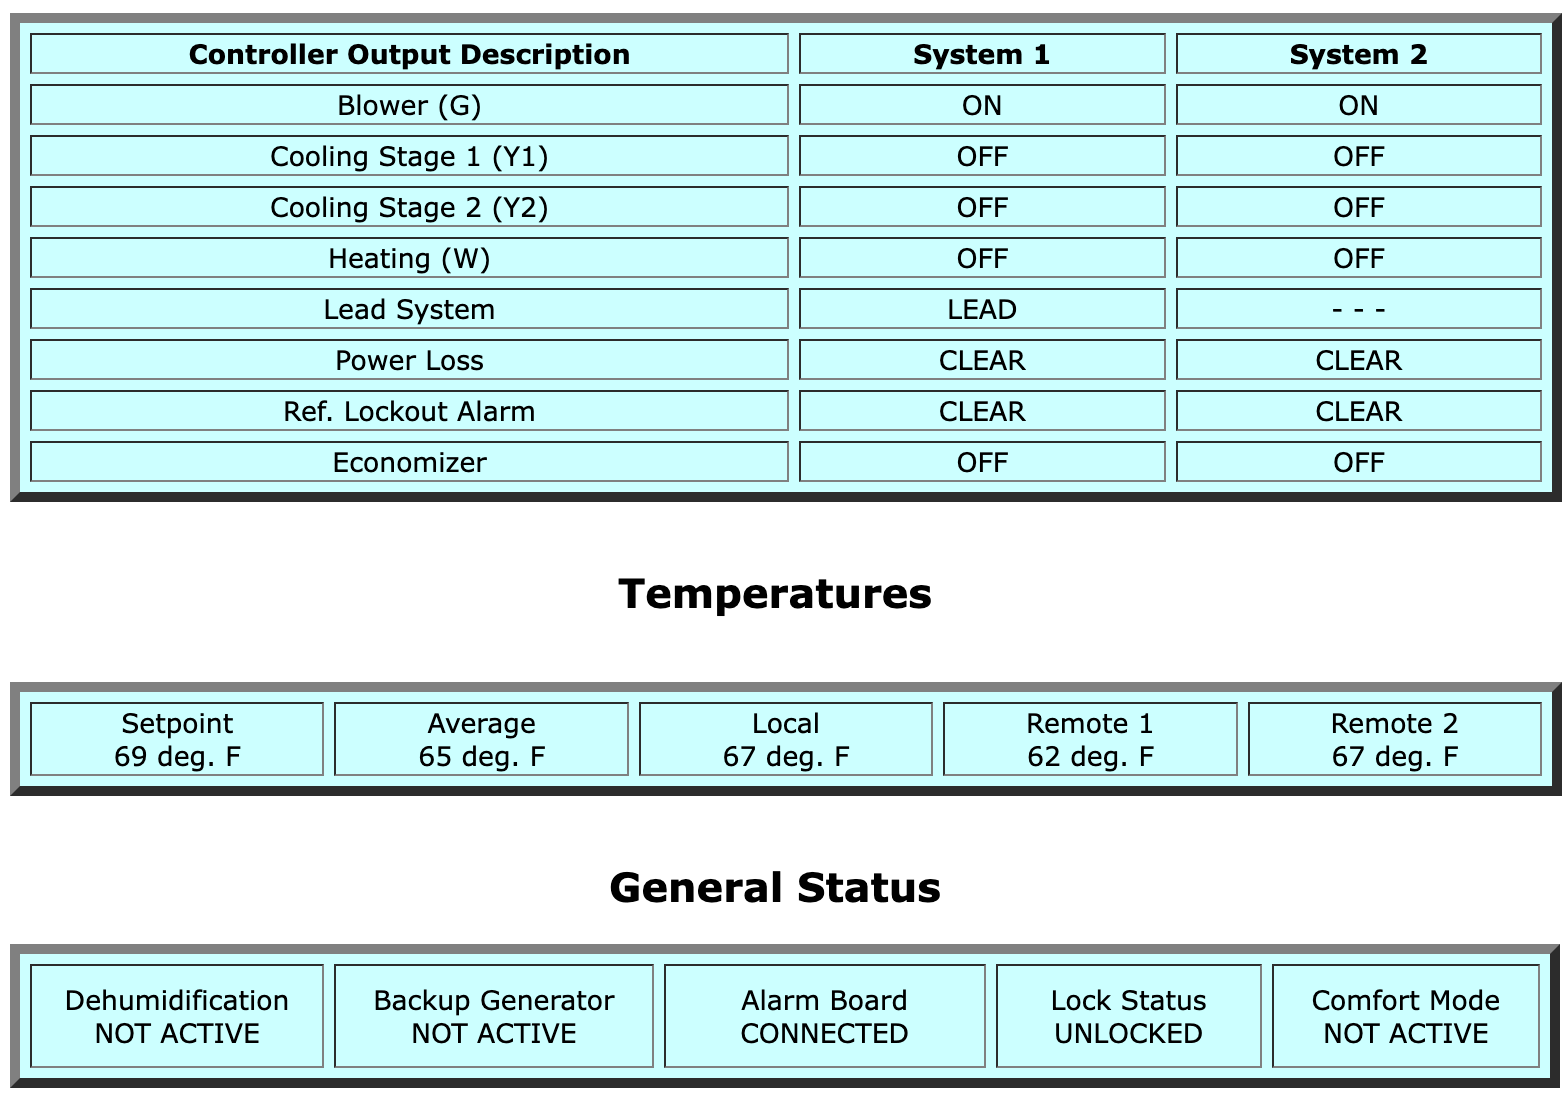
In the image above, we have a mix of digital and analog status points. The method we will use to retrieve the data is the same, but how we store them will be different.
If we right-click and view source to examine this table, we find that the method of which the data is being displayed is slightly different than the log in we worked with earlier. Instead of the data being directly available in the HTML code, a placeholder exists.
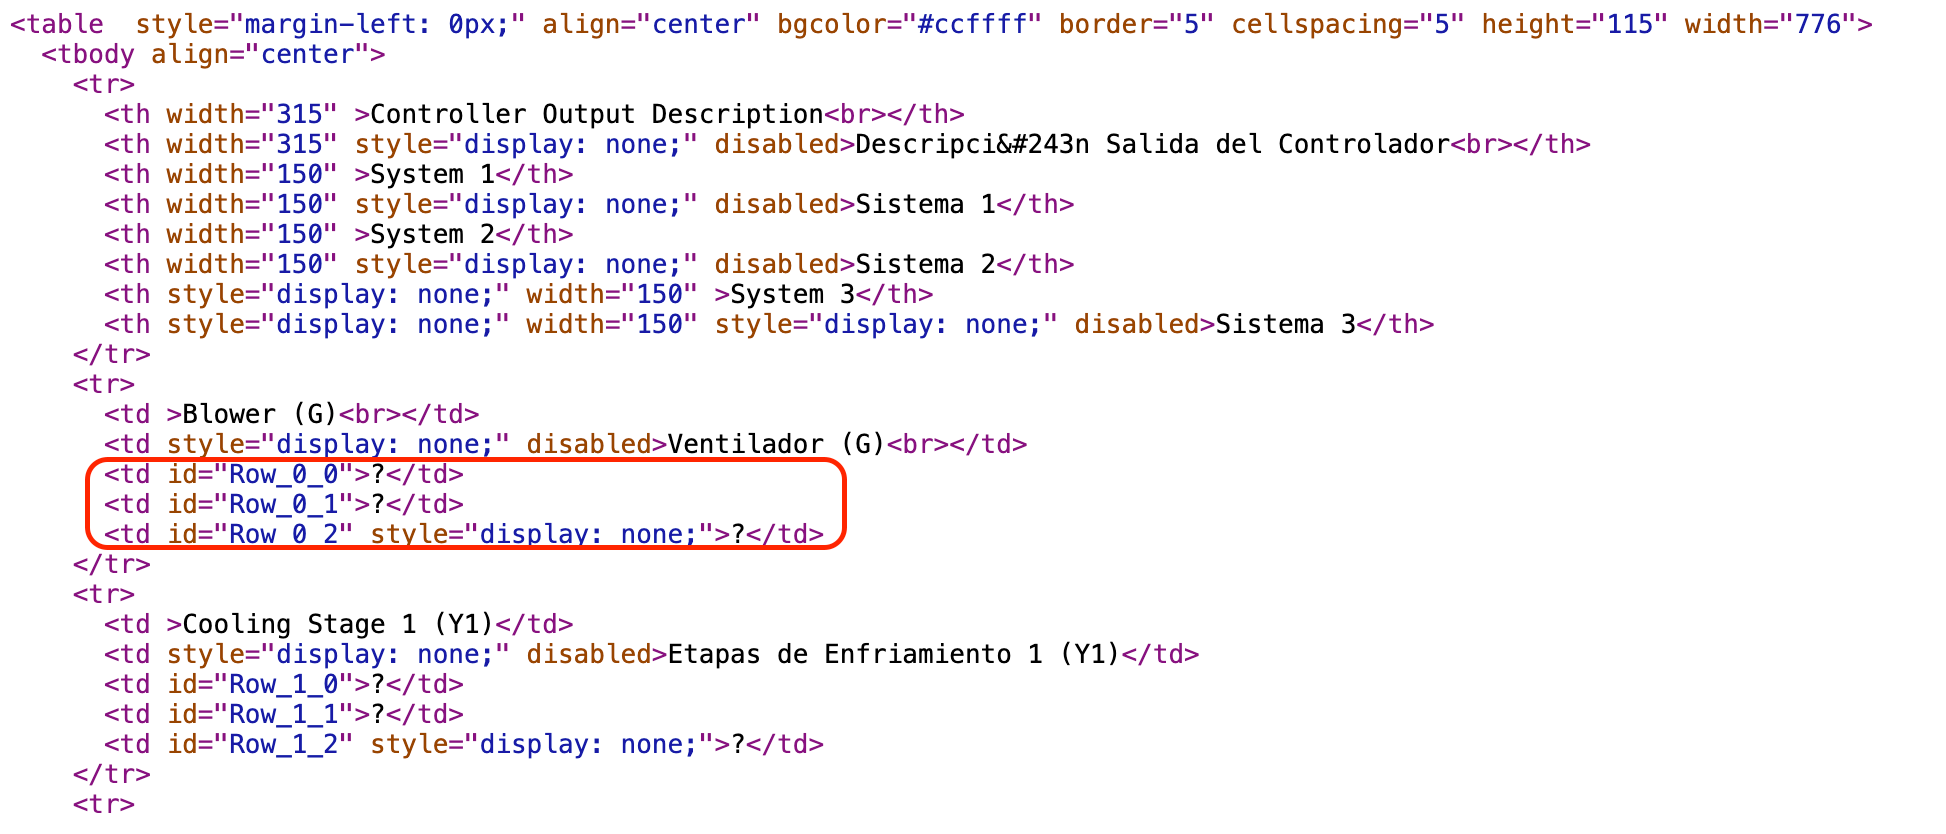
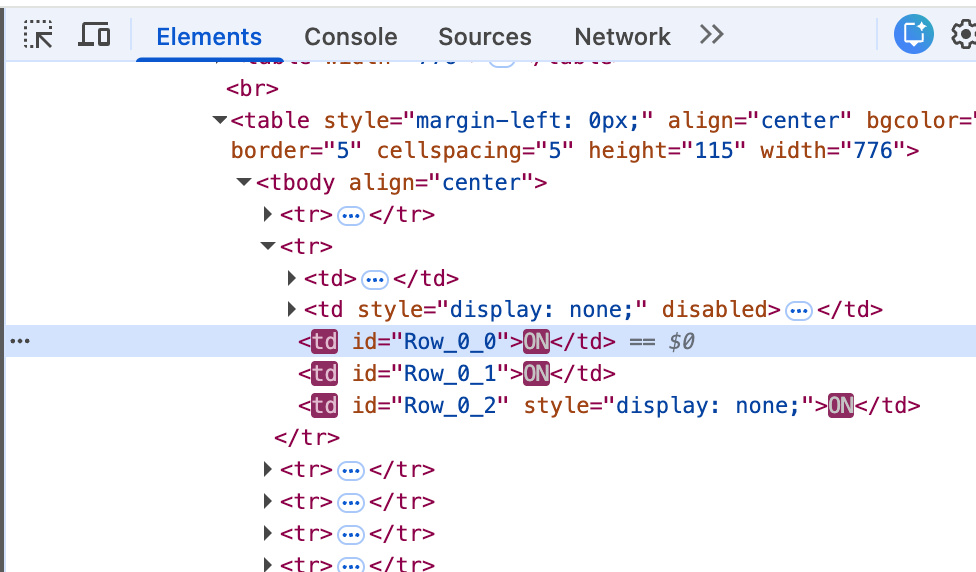
If the data doesn't exist directly in the code, how will we be able to gather it? Well, it is true that the source code of the website doesn't contain the data, but if we right-click and "inspect" the table in real-time, we can see that something is updating that variable so that the end-user sees the true value.
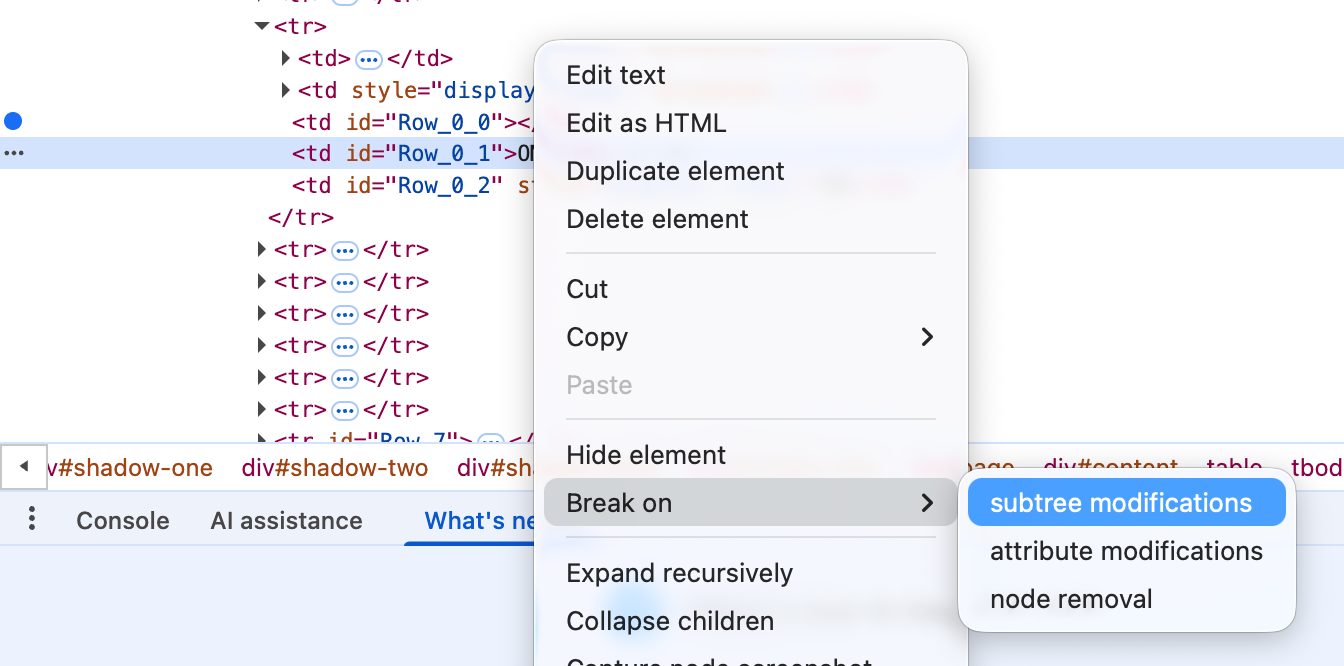
We know the HTML is being updated, but we don't know how. To find out, we can tell Chrome to trace the origin of the updates the next time it happens. Right-click and inspect the changing element again, then right-click the actual element updating and select Break on subtree modifications.
Once you set the breakpoint, the next time the variable is updated you should get redirected to the Sources tab where the code responsible for updating the subtree will be highlighted. Below you can see that the HVAC controller is using Javascript to update the values in real-time.
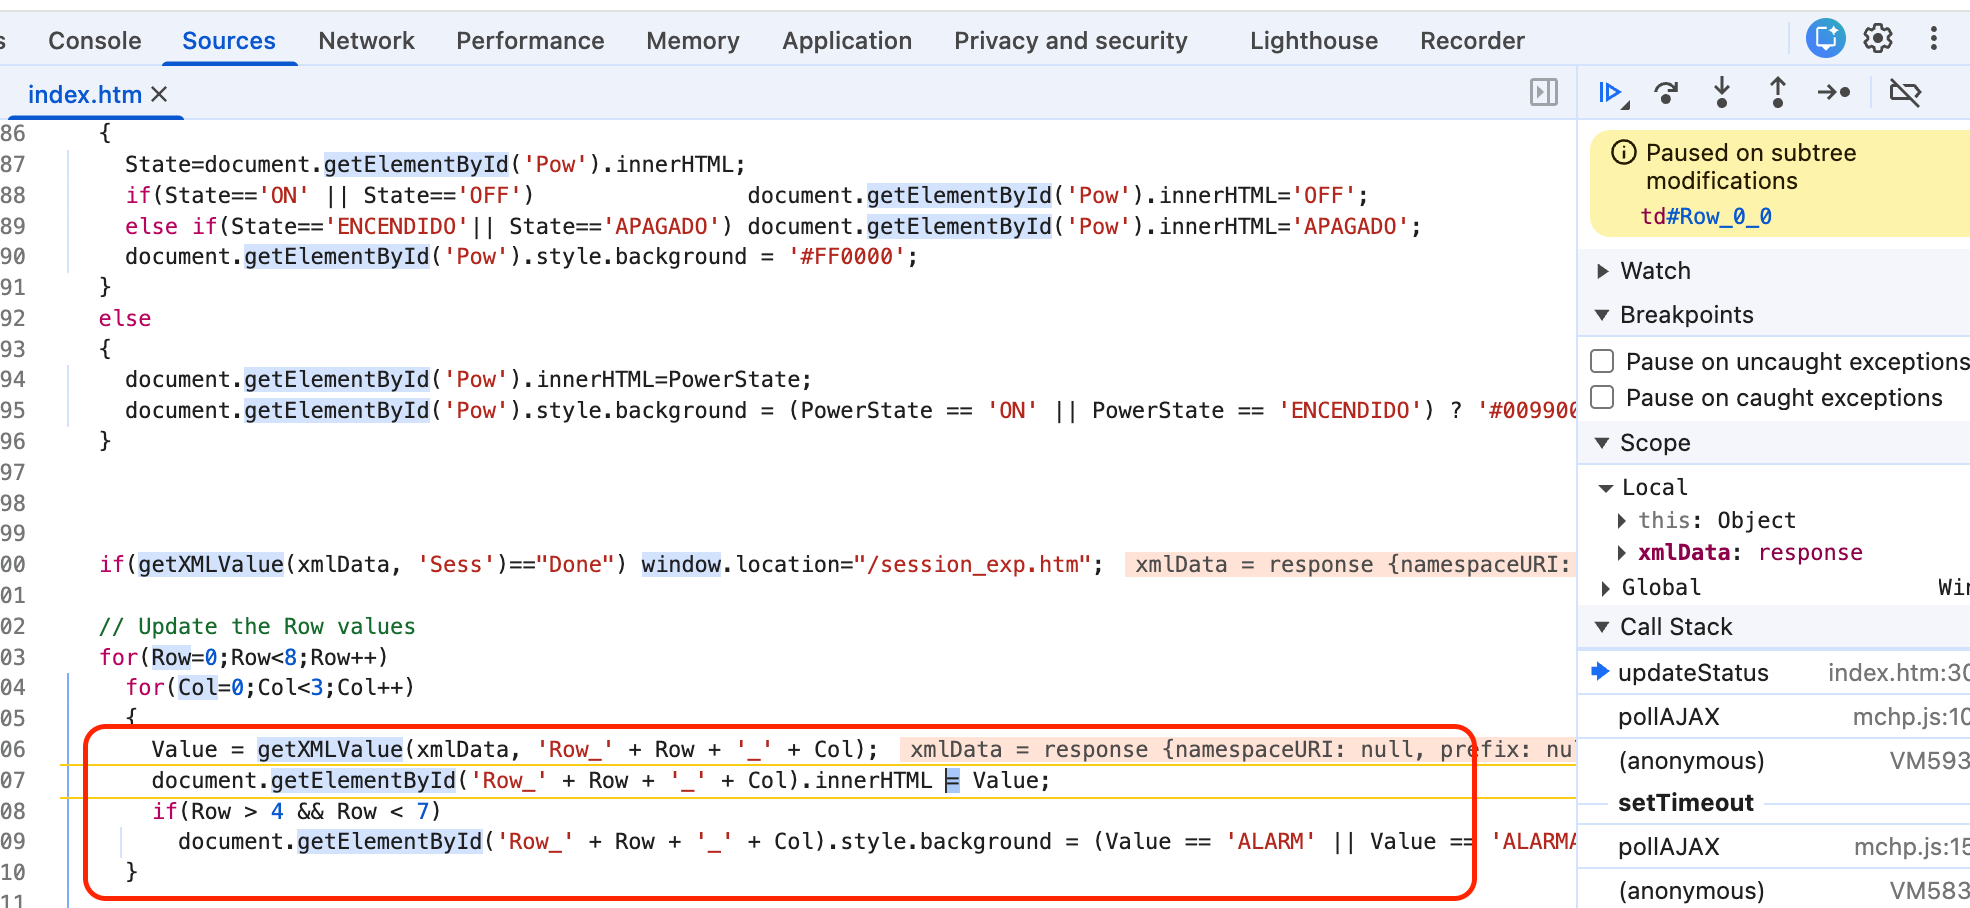
If you examine the Javascript code above, you will notice that the value being sent to the DOM is sourced from an XML data structure. So now we need to find this data structure's definition so we can interact with it directly. Remember, the goal here is not to completely emulate a user browsing the webpage, its to interact with the core system directly driving the data changes. This is going to require digging through the manufacturers source code. To download the code, simply save files from the developer console in Chrome.
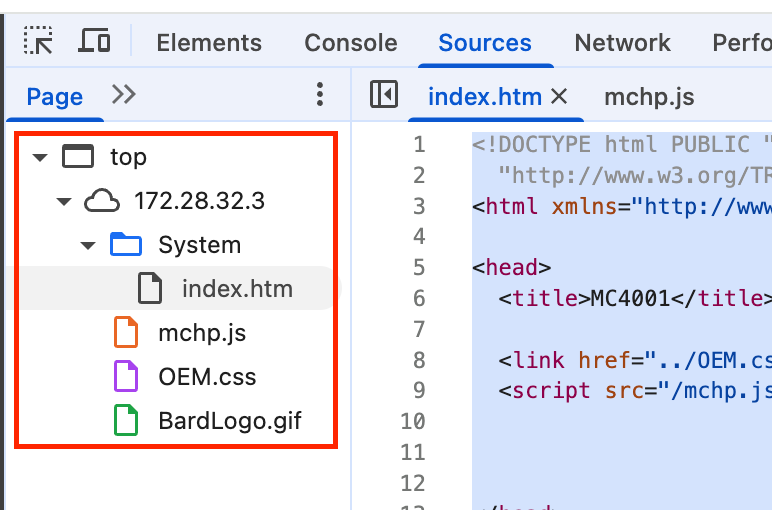
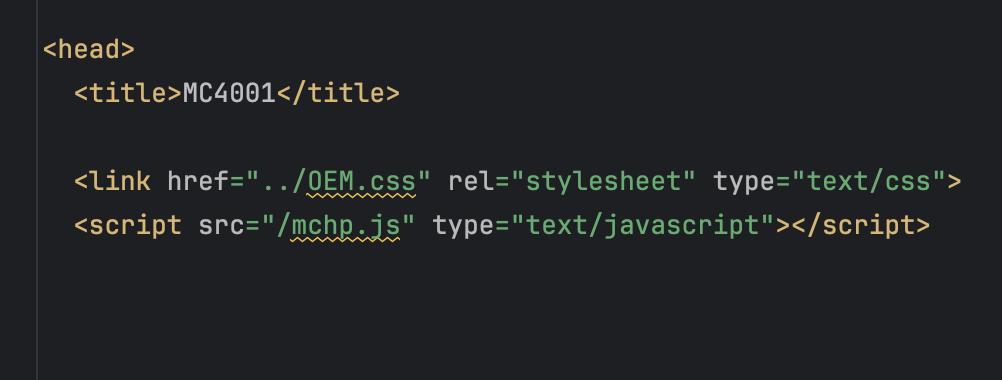
When you read the source code for the index.htm file, you will not find the definition of getXMLValue.You will need to go one level deeper and read their library code that is loaded at the top named mchp.js.
After you search the library, you will find the definition of the function like below.
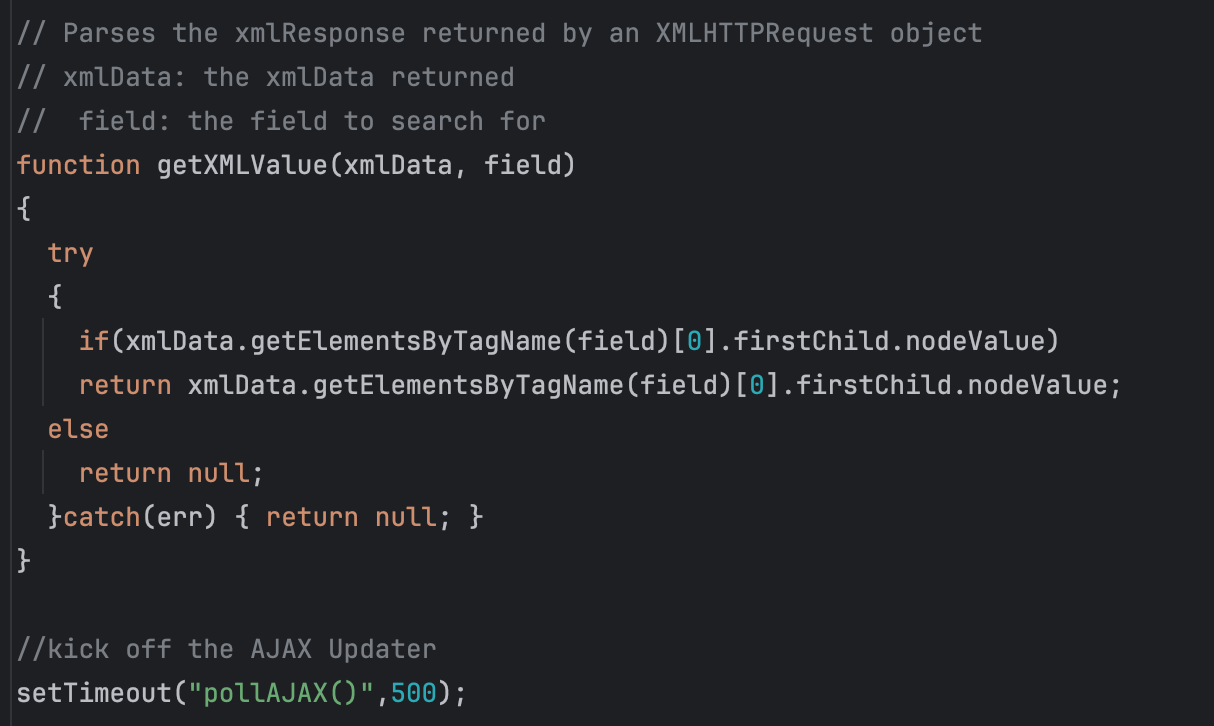
Remember that the code we are tracing is below
Value = getXMLValue(xmlData, 'Row_' + Row + '_' + Col);
We now know that the function getXMLValue basically just parses the data passed in xmlData. Now we need to trace xmlData. If we examine when and how these functions get called, we find that the code updating the DOM is itself inside of a function called updateStatus.
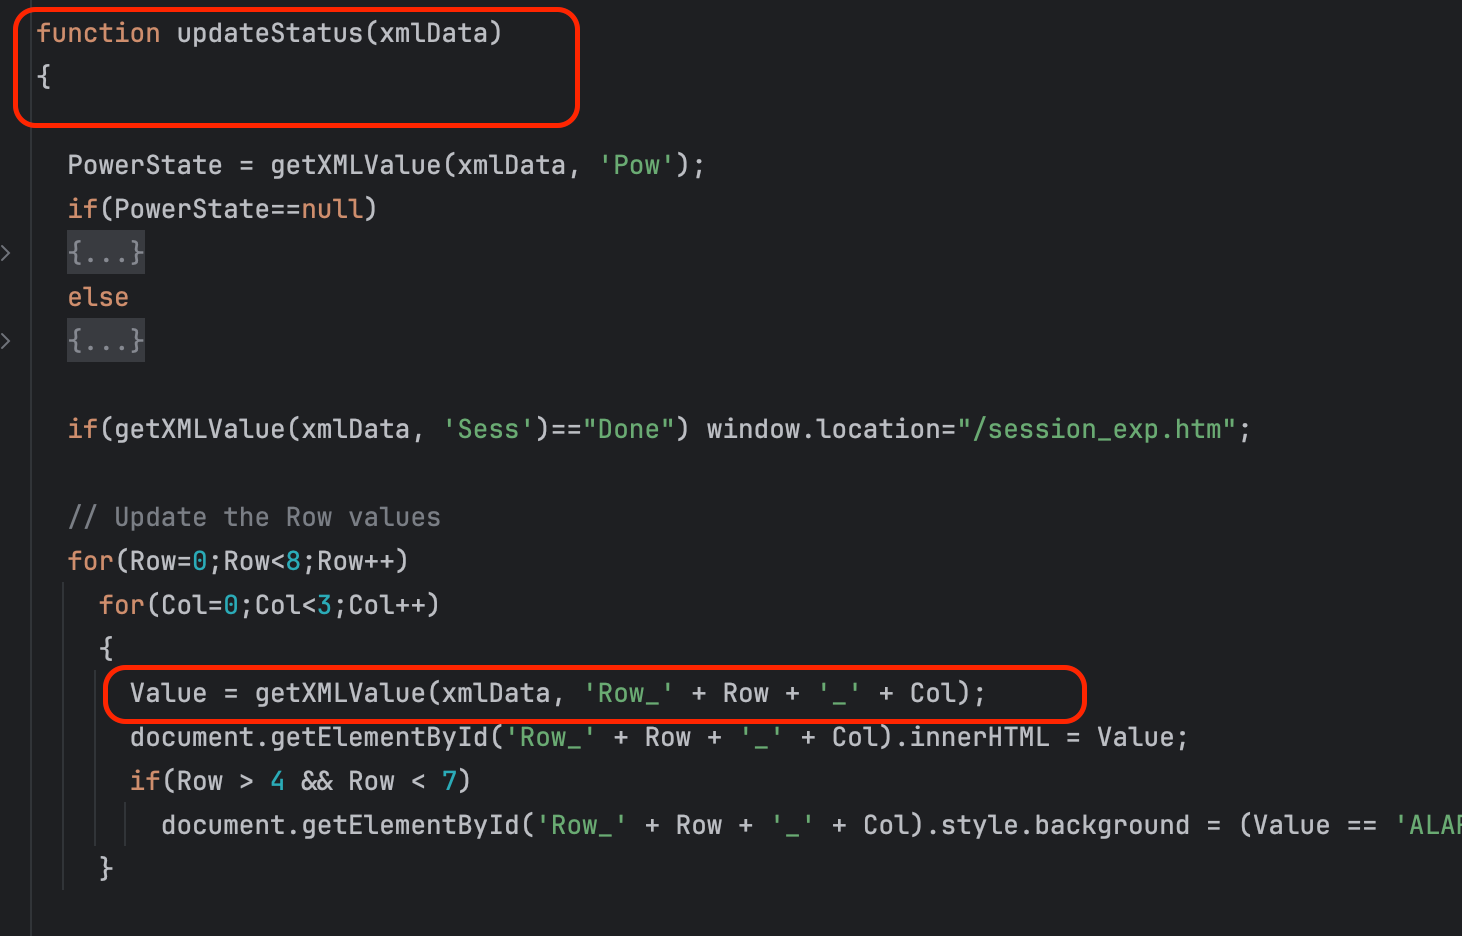
So there must be code calling updateStatus and supplying the XML data. This code can be found at the bottom of the page.
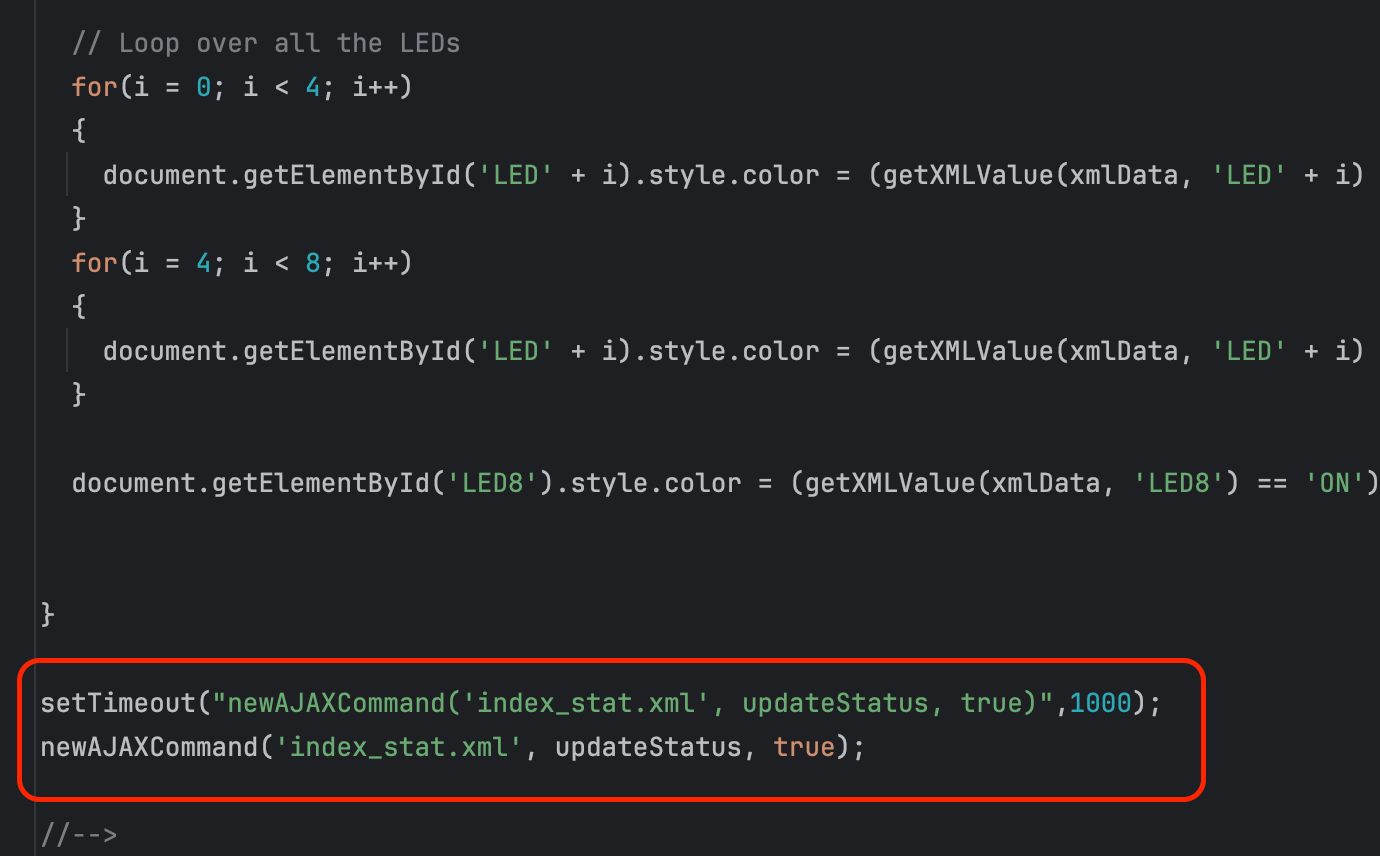
Buried at the bottom of the source javascript there are two functions that mention the function (updateStatus) we are interested in. And inside those functions, we can see the source data structure (index_stat.xml) being parsed to update the DOM. If we go back to Chrome developer tools and select the "network" tab, we can examine this data file directly.
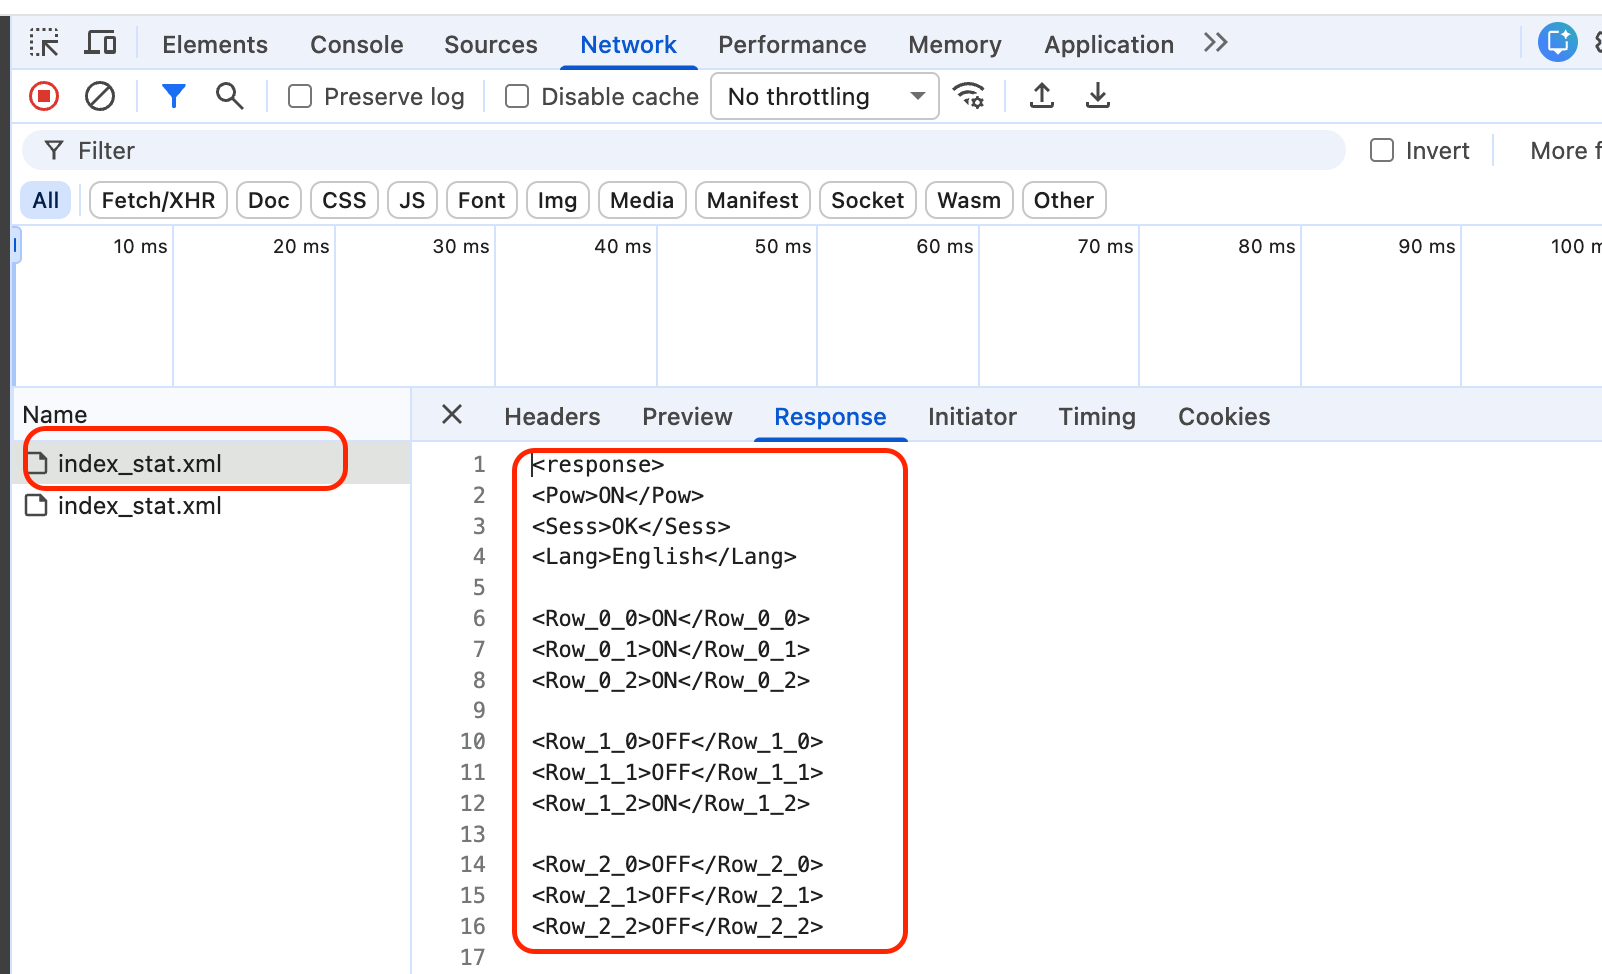
You might be wondering why we are in the network tab and why these files aren't in the same spot as the other files we downloaded from the server. The reason is that these files themselves are being downloaded from another location through the Asynchronous Javascript (AJAX) function dynamically.
Getting the data
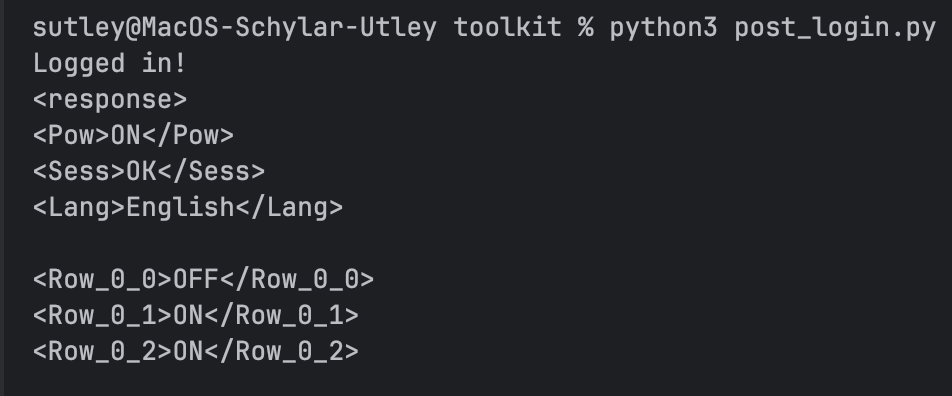
Okay, so we've traced through all the source code files to find exactly how and where the data lives that is being used to update the webpage dynamically. Now we need to grab the data from index_stat.xml directly from Python which we already know how to do.
if (login_response.status_code == 200):
    print("Logged in!")
    status_xml_url = "HVAC IP" + "/System/index_stat.xml"
    xml_response = session.get(status_xml_url, timeout=1)
    xml_response.raise_for_status()
    print(xml_response.text)

else:
    print("Log in failed :(")
Updated source code section for test script
Parsing the data
We now have a Python text variable containing the values of the table we want as raw XML text. Now we just need to parse the variable to turn the data from XML text structure into a Python data structure that we can easily reference.
You will need to include XML libraries for this next section import xml.etree.ElementTree as ET
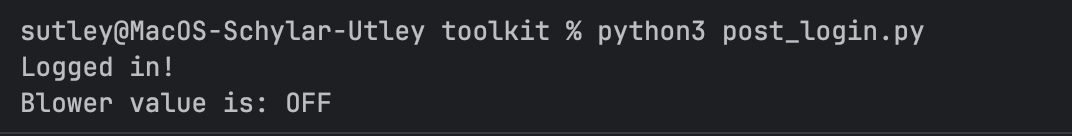
Now that we can work with XML, lets try to get the Blower digital status point which we know from earlier is stored at Row_0_0
if (login_response.status_code == 200):
    print("Logged in!")
    status_xml_url = "HVAC IP" + "/System/index_stat.xml"
    xml_response = session.get(status_xml_url, timeout=1)
    xml_response.raise_for_status()
    root = ET.fromstring(xml_response.text)

    element = root.find(".//" + "Row_0_0")
    print(f"Blower value is: {element.text.strip()}")

else:
    print("Log in failed :(")
Updated source code section for test script
Saving the data
We now have a script that can pragmatically gather data from the HVAC controller without any sort of APIs or standard pragmatic access. This is great for developers, but this doesn't mean much for the facilities department. They need to see this information on a dashboard and for that, we bring in Zabbix and Grafana.
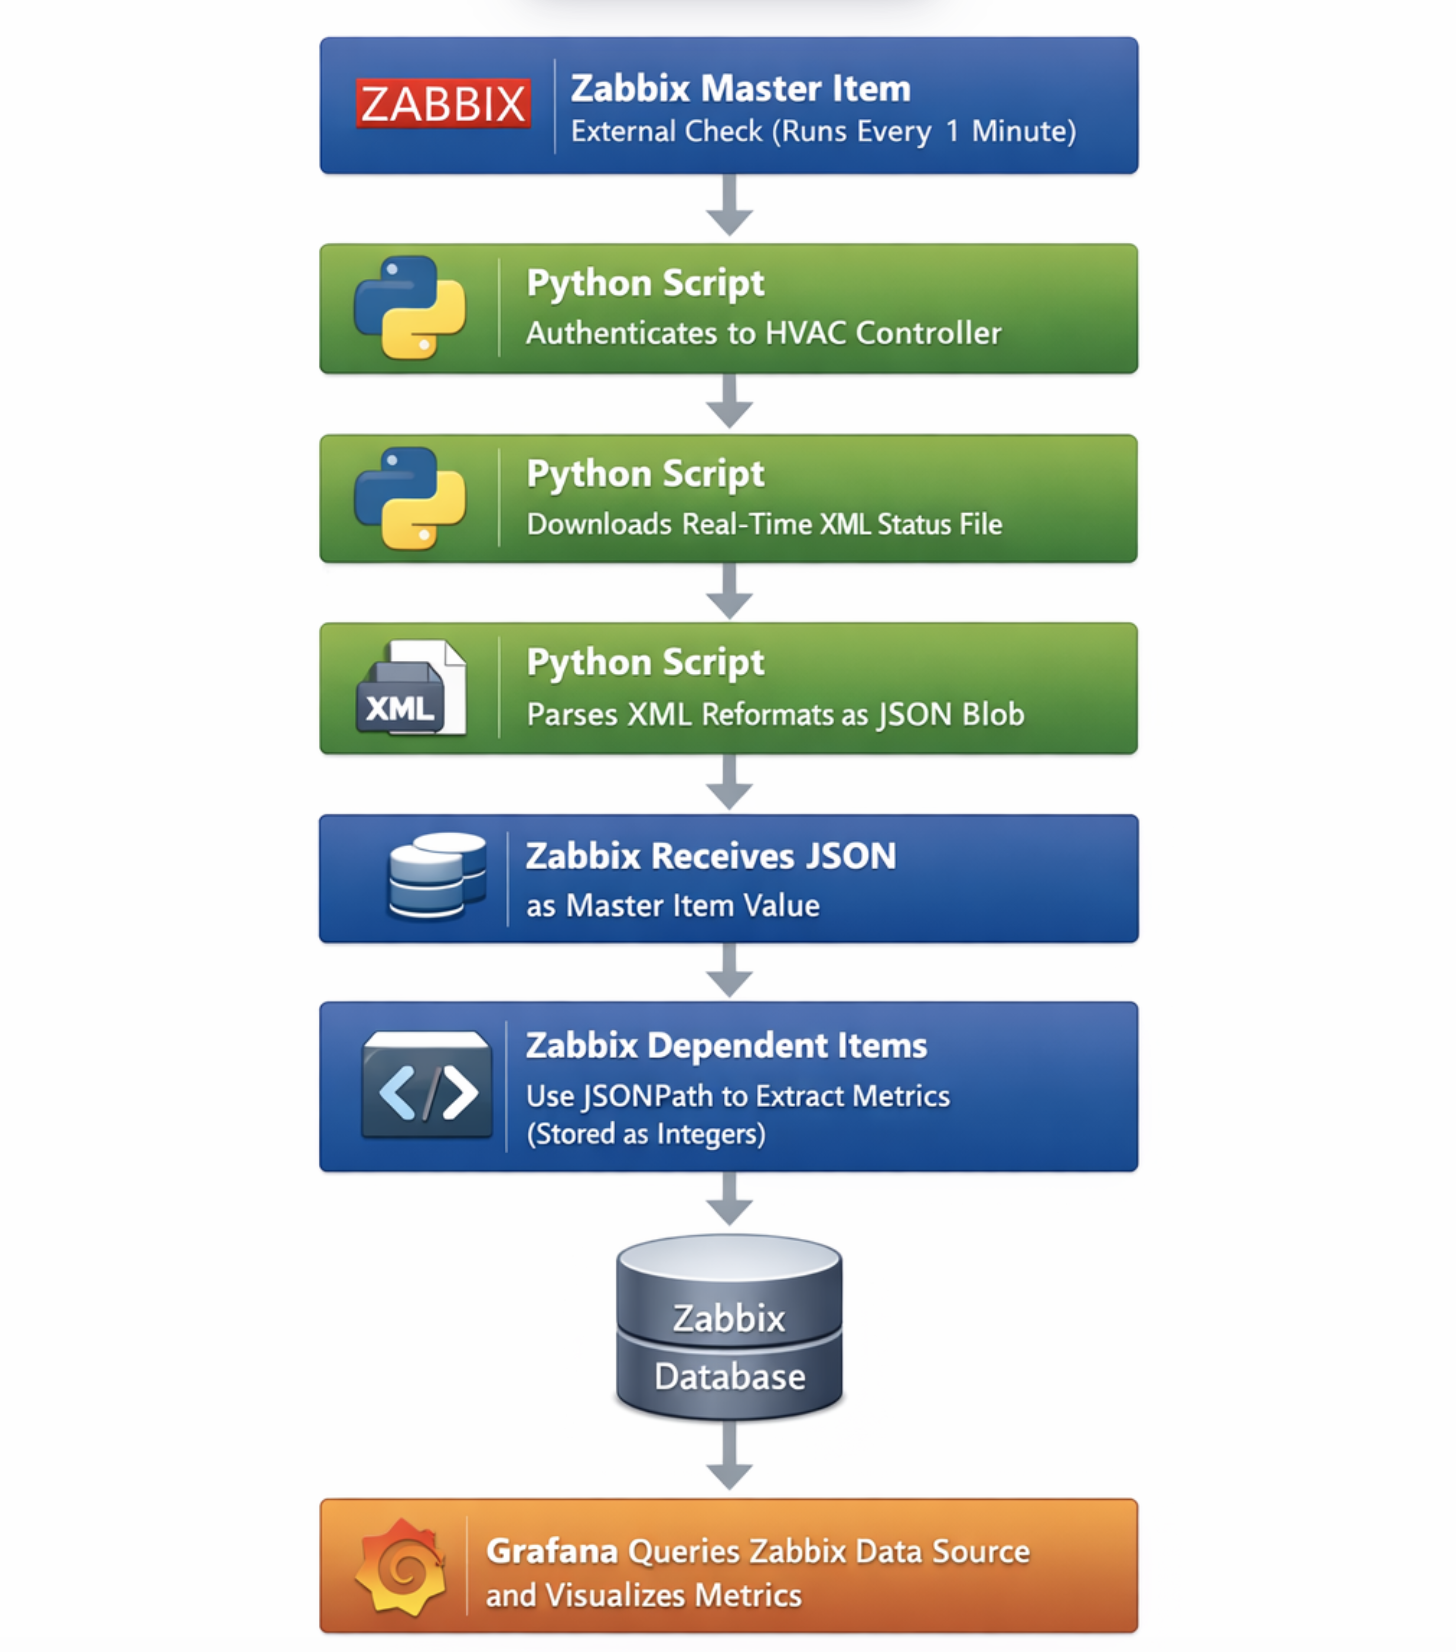
As discussed in previous posts, Zabbix can run Python scripts on scheduled intervals and store the results in a time-series database. Here is the plan:
- Create a Zabbix item that runs the Python script and saves the result as JSON blob
- Create another Zabbix item that parses that JSON blob and saves the result as a single item
- Create a dashboard that references the time-series database data and displays data over time for a human to analyze
Zabbix item creation
For the first step of saving the Python data, we need to create the item. When building exploratory models like this, it is easier to build the item directly on the host to test and then move to a template for scalability. For brevity, we will skip right to the template item.
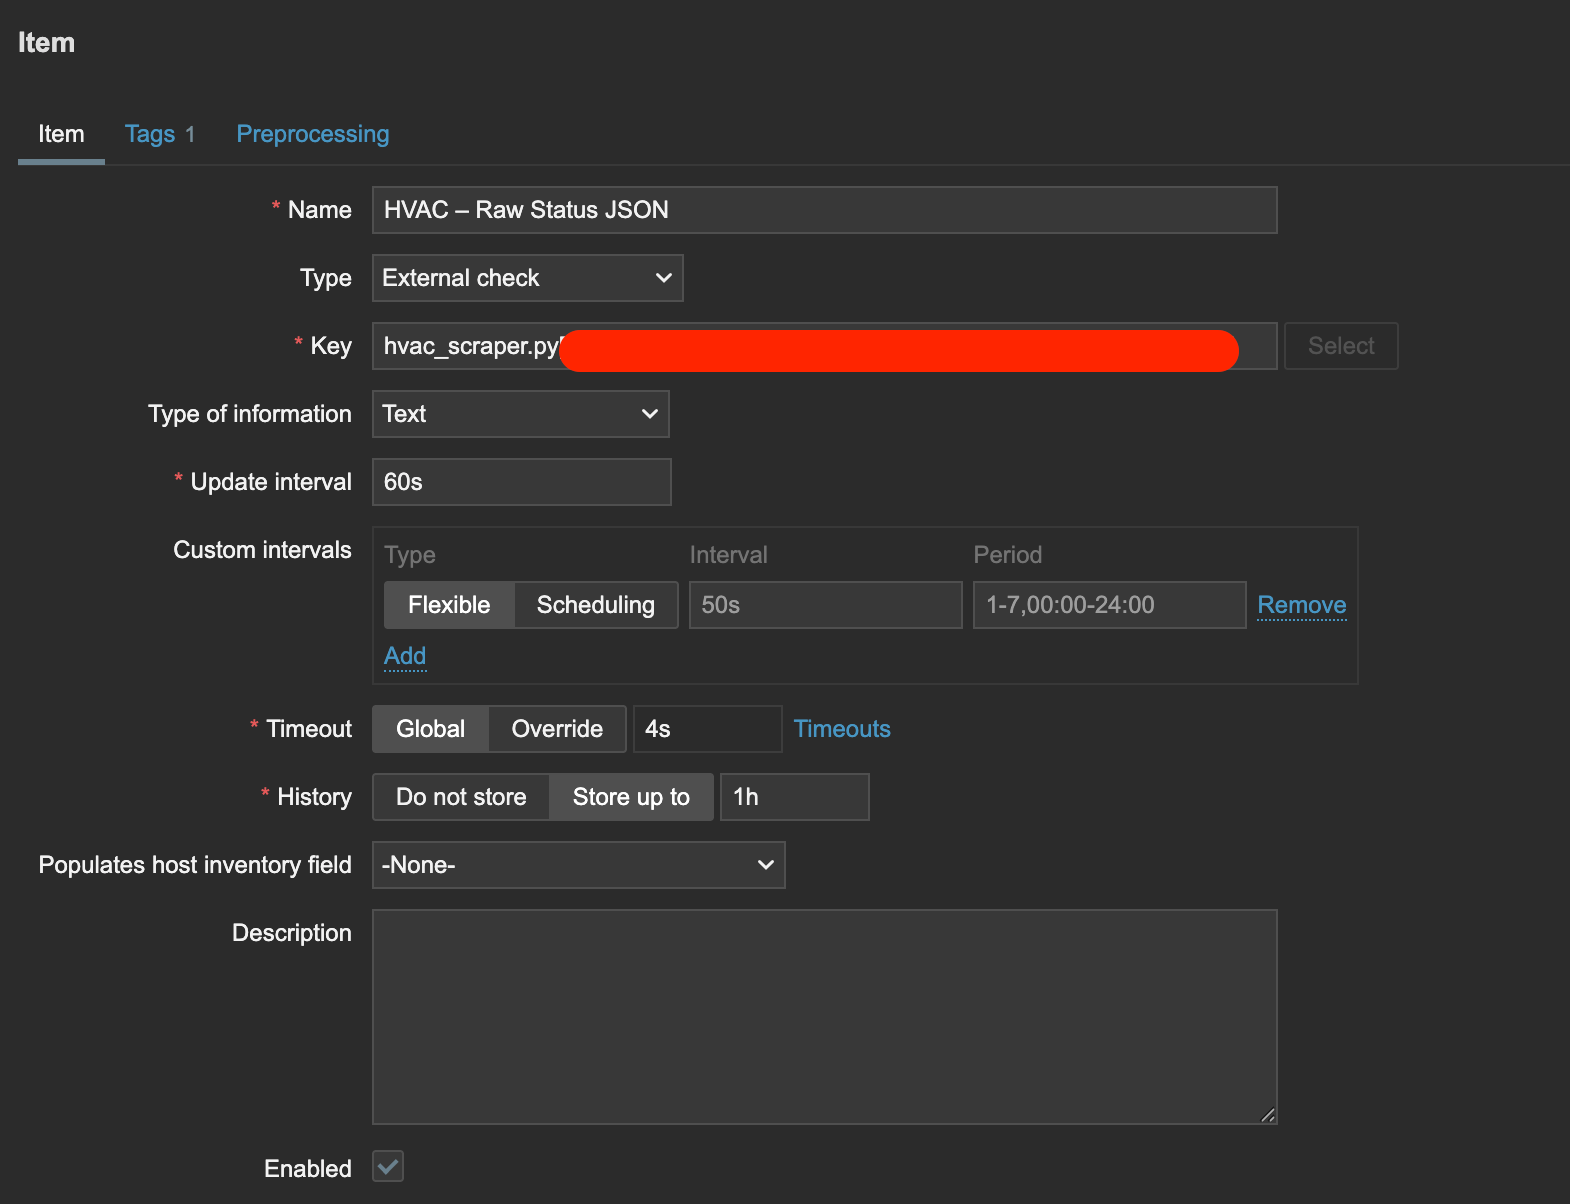
When you are creating this item, remember that you will need to transfer your Python script to whichever server or proxy is running this check. For external check's, the key is the script and related parameters to run. I have named this script "hvac_scraper.py" which the source code can be found here: https://github.com/MajesticFalcon/Bard-MC4100-Scraper
For my script, I take three parameters: IP, User, Pass. The first one is injected into the script through the HOST.IP macro, whereas the other two are injected through the global macros.
The last piece here is to make sure you are using "text" as the data type to make sure we save the JSON blob correctly.
Python placement for Zabbix
Now we need to move the script to the right location and make sure permissions are good to go. Don't forget to add the shebang in your script!
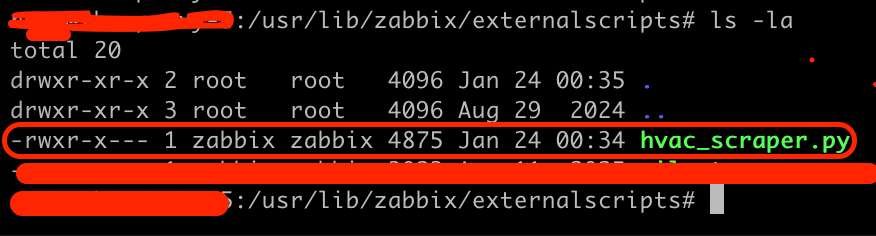
chown zabbix:zabbix ./hvac_scraper.py
chmod 750 ./hvac_scraper.py
Permissions for the file
Zabbix variable parsing
Now we have the data for all of the analog and digital status points of the HVAC being saved as a single piece of JSON text in the Zabbix database and being fetched every minute. Now we need to pull some of those variables out into their own items so we can track them individually and display them.
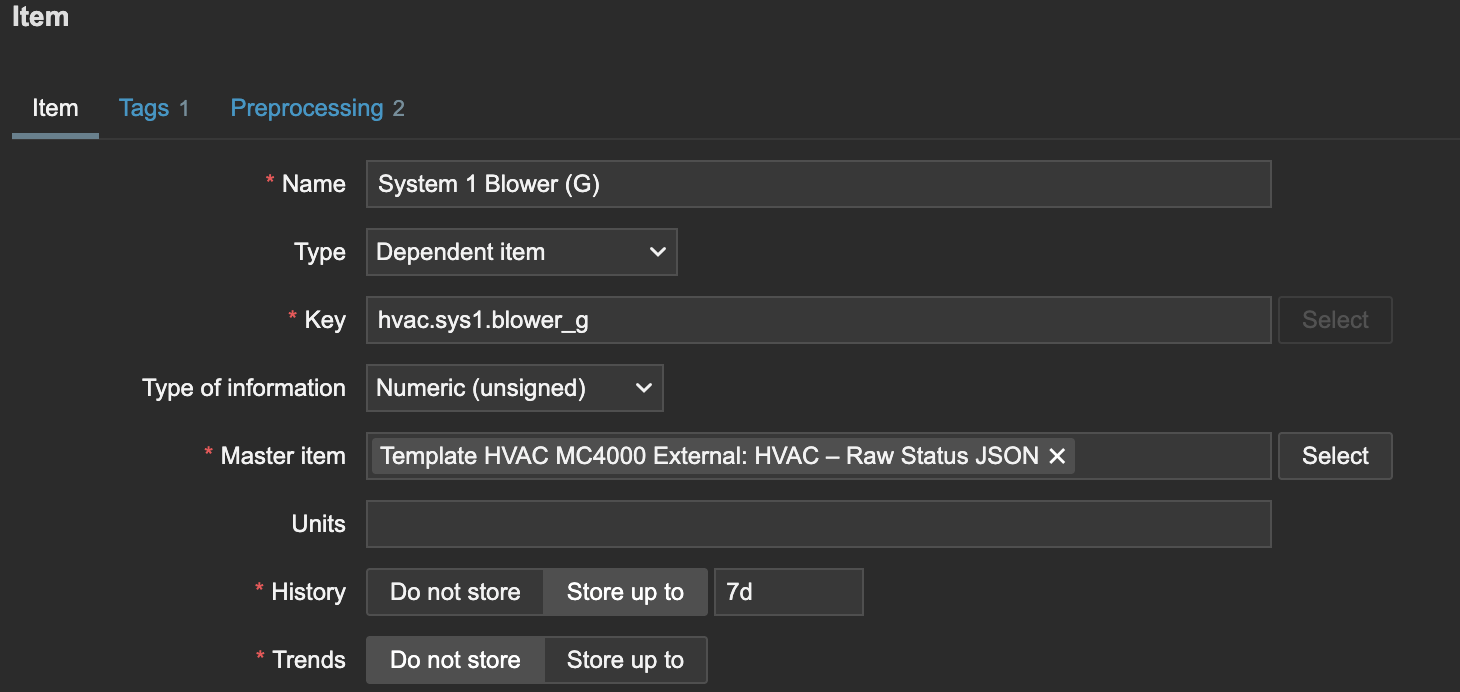
In the image above, you can set the name and key to whatever you want. The important piece is setting the Type to "Dependent item" and selecting the previously made JSON blob as the "Master item." This tells Zabbix that we already have the data we want for this item inside another item.
Now we go to Preprocessing to tell Zabbix how to pull the data out of the JSON blob. JSONPathing is outside the scope of this article.
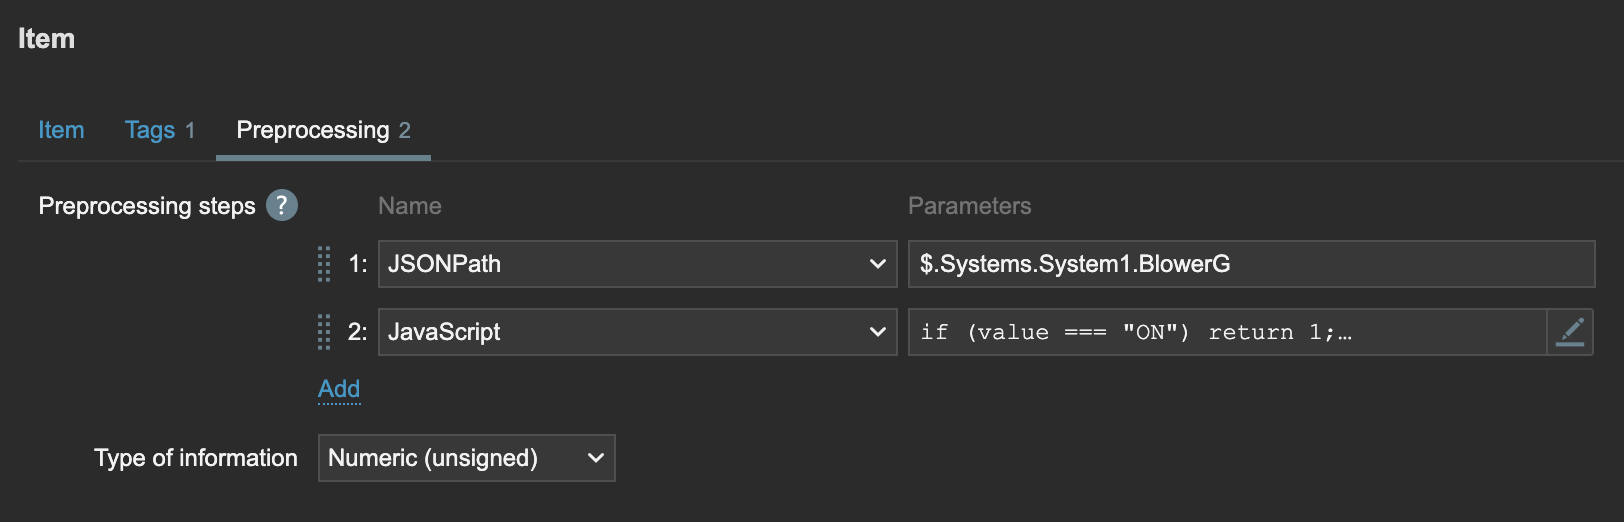
If you would like to store the data as a integer, add the Javascript Preprocessor below and adjust for your own preference of values.
if (value === "ON") return 1; return 0;Scaling out
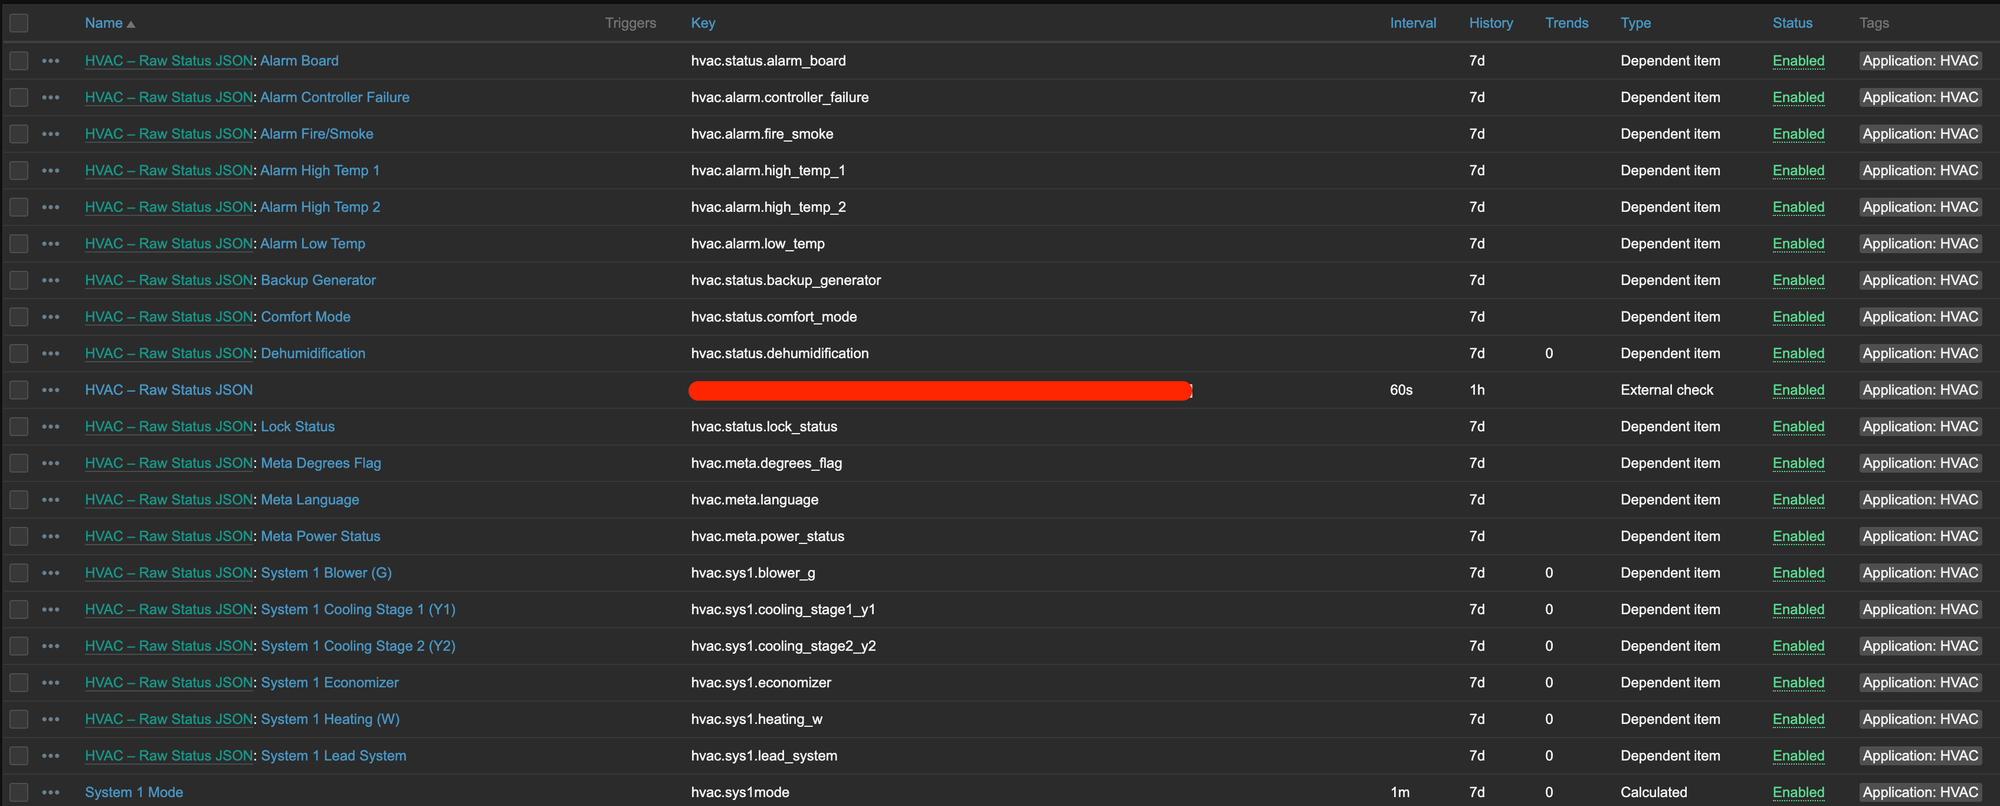
Once you have completed the definition of a single item and its testing good, you can scale out all of the variables. I ended up with the following:
Visualizing the data
We are at the final stretch. All that is left is building the visualizations for all the data. We are going to create two dashboards: one to summarize all locations and one to drill into a specific location.
The summary data
One of the main goals for the summary dashboard is to see how the entire HVAC infrastructure is acting over time. Are we dehumidifying a lot, is the heat constantly on, are the economizers cycling a bunch, is there an event impacting several locations all at once?
Remember earlier when we talked about storing the XML data as text vs integers. If you decided to store as text, you have to skip this section as you can't run statistical analysis with Grafana using non time-series compatible data.
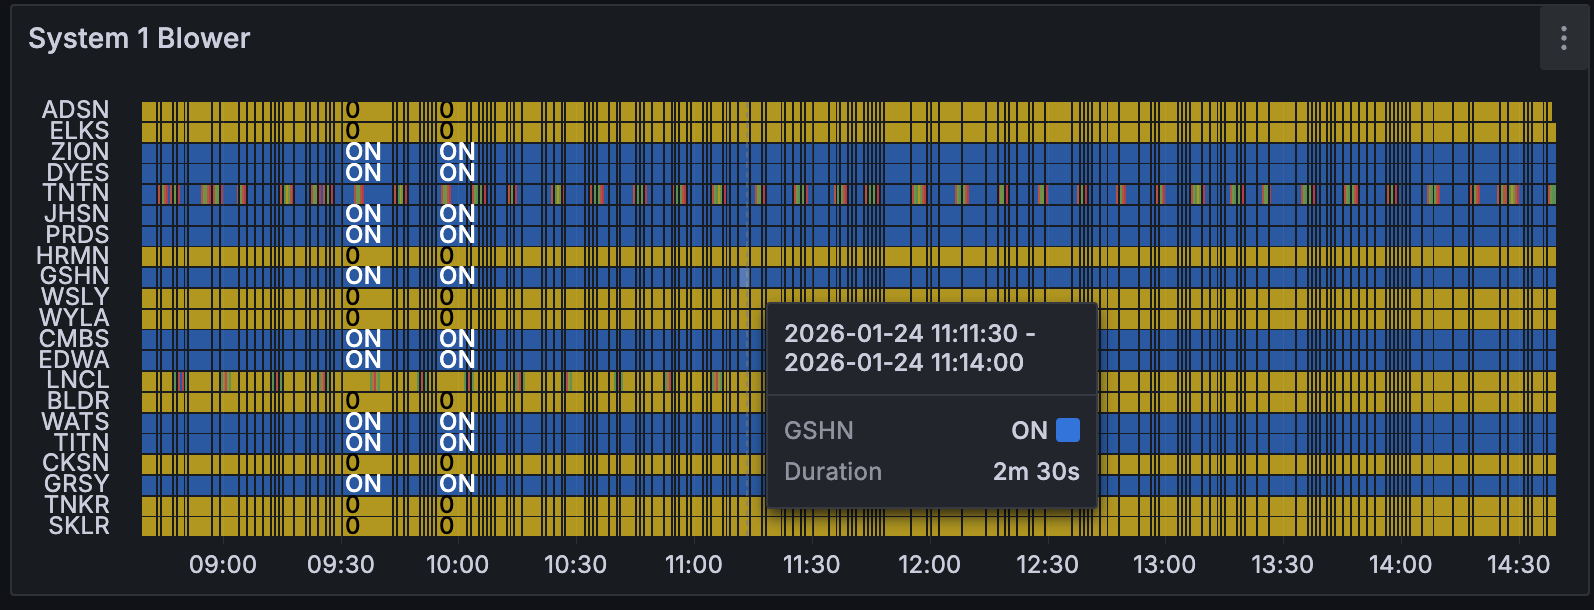
We are going to continue using the Blower variable as a focus and create a dashboard panel that shows how HVAC1 and HVAC2 Blowers are activating over time.
Create a new panel in Grafana using the "State timeline" and set the Query type to Metrics, and select the appropriate group that has your HVAC controllers in it. Then use the wild card regex /.*/ to select all HVAC controllers and select the System 1 Blower item or whichever you want to graph over time.
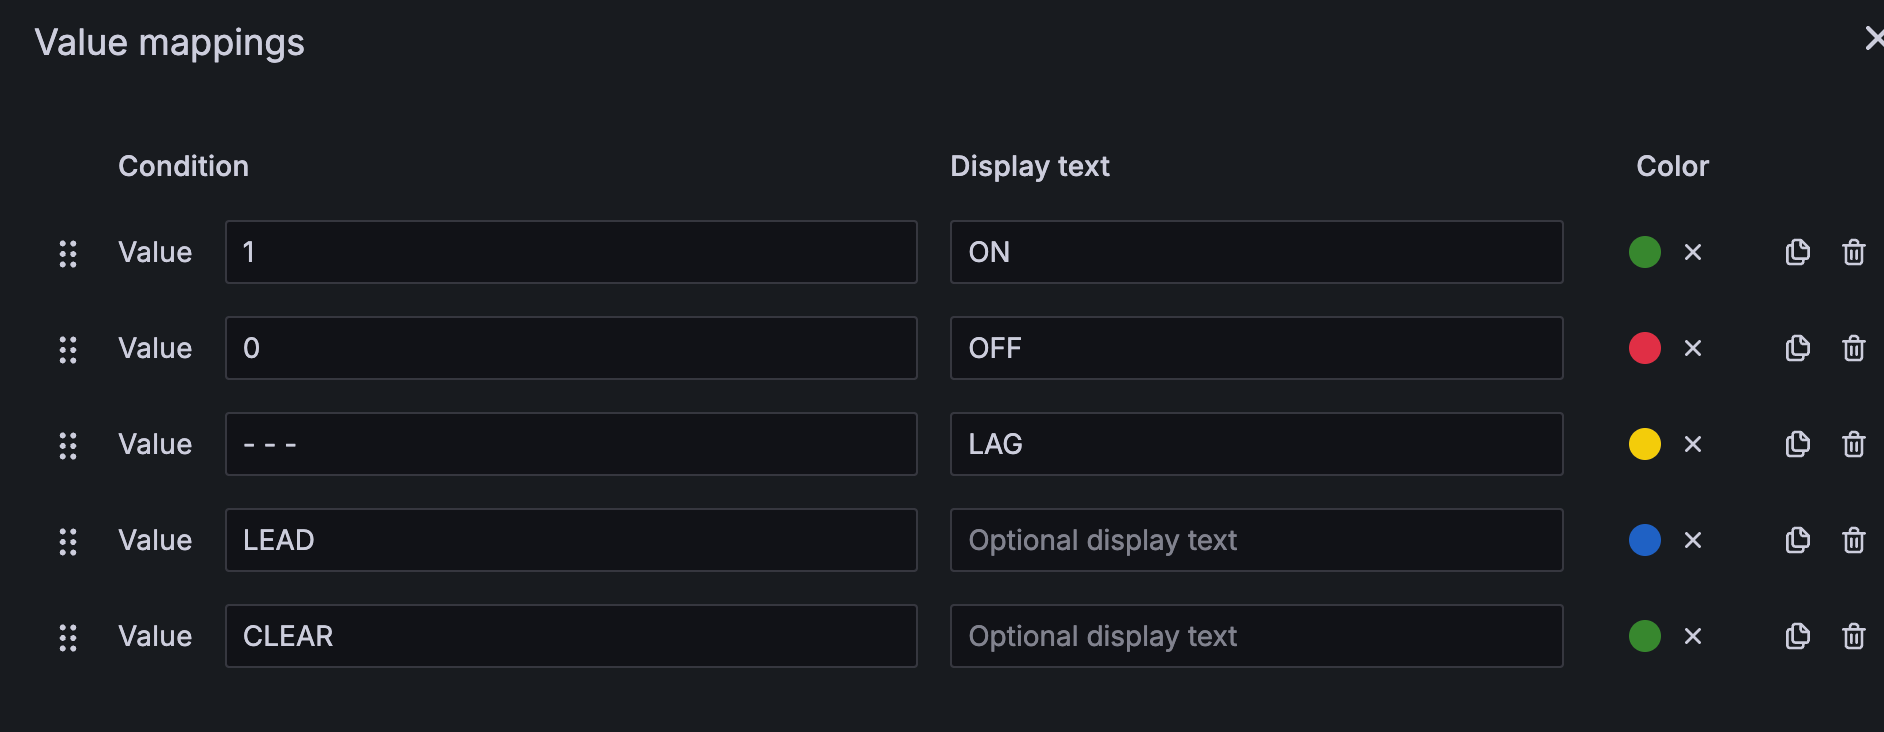
Then simply set a value mapping between the integers you selected and the result you want to display. I chose to display "IDLE" as Yellow and defined it as 0 in the database. Therefore, here are my value mappings:
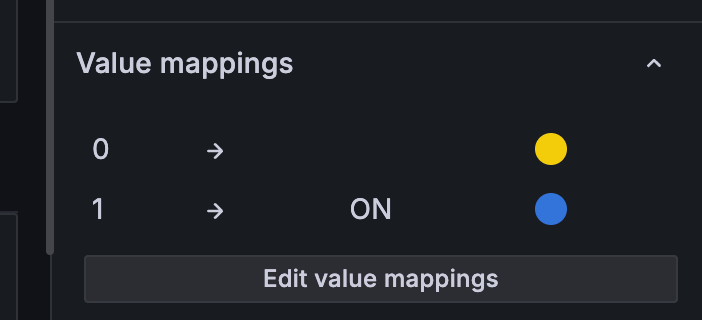
And here is the result:
For each metric you want to see over time, simply replicate the panel and change the item and value mappings as needed.
The detail data
We completed the summary panel first because its quite a bit simpler. In this section we will work through creating variables in Grafana, then using those variables and data transformations to get the data massaged into the format you need it.
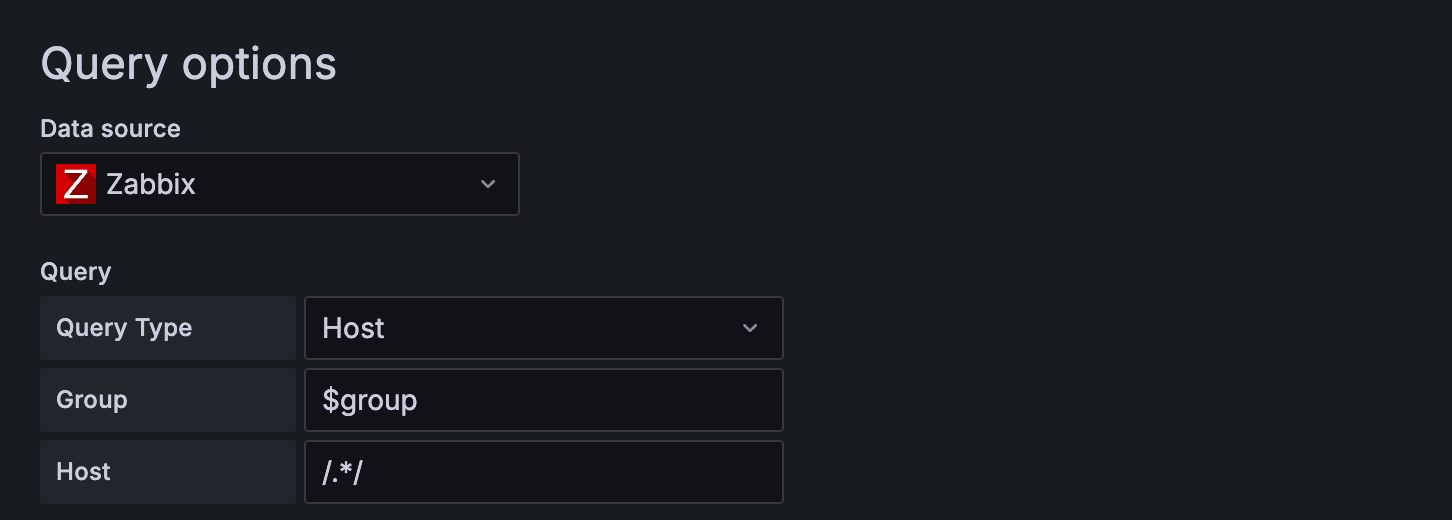
Create another dashboard and in the settings create 1-2 variables. If you have more than a single group of HVACs, you may need both a group and host variable. We will assume this is the case. Create the group variable using the datasource Zabbix, the Query Type "Group" and the Group will be whichever Group(s) you want to select from. Create the host variable the same way but reference your previously made group using $group and the Host using the wildcard /.*/.
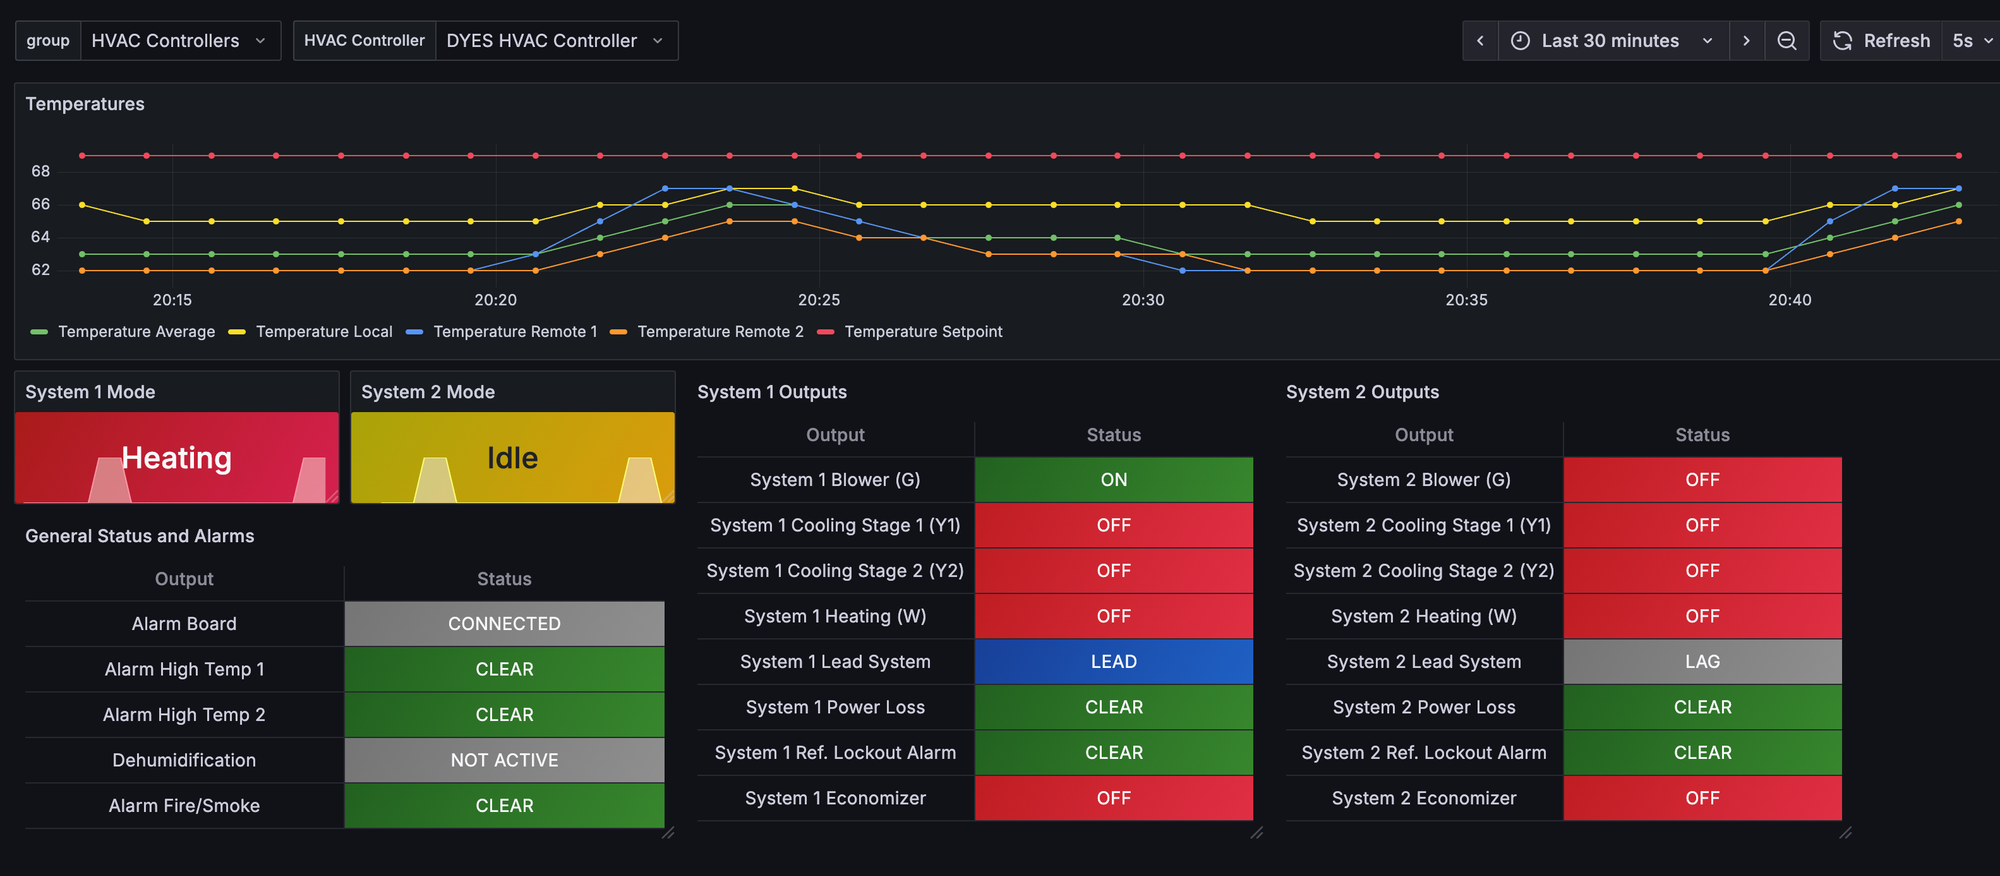
Once you have the group and host completed, you can create all the graphs as you would normally. We are going to skip the graphs and get into how we end up with the following dashboard:

The status point data
Notice that we are displaying tables but have a timeframe and time-series data. Pretty weird if you think about it. What data should we show in the table if we collected 1000 data points in the last 30 minutes. That is the caveat of this detail screen, we will need to understand that the table data is the last known good value of the system.
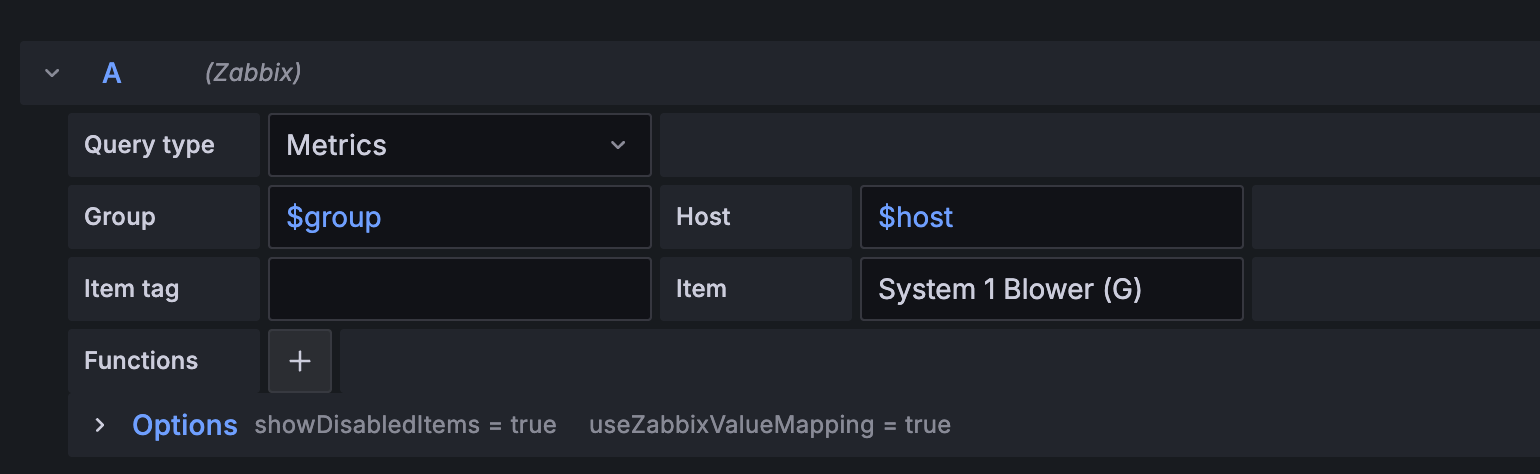
To create the status tables, create a new panel with the Table visualization. In the Query Type, use Metrics and fill out Group and Host with your variables. Finally fill out the item with the Zabbix item you want to display. Here is what my definition looks like:
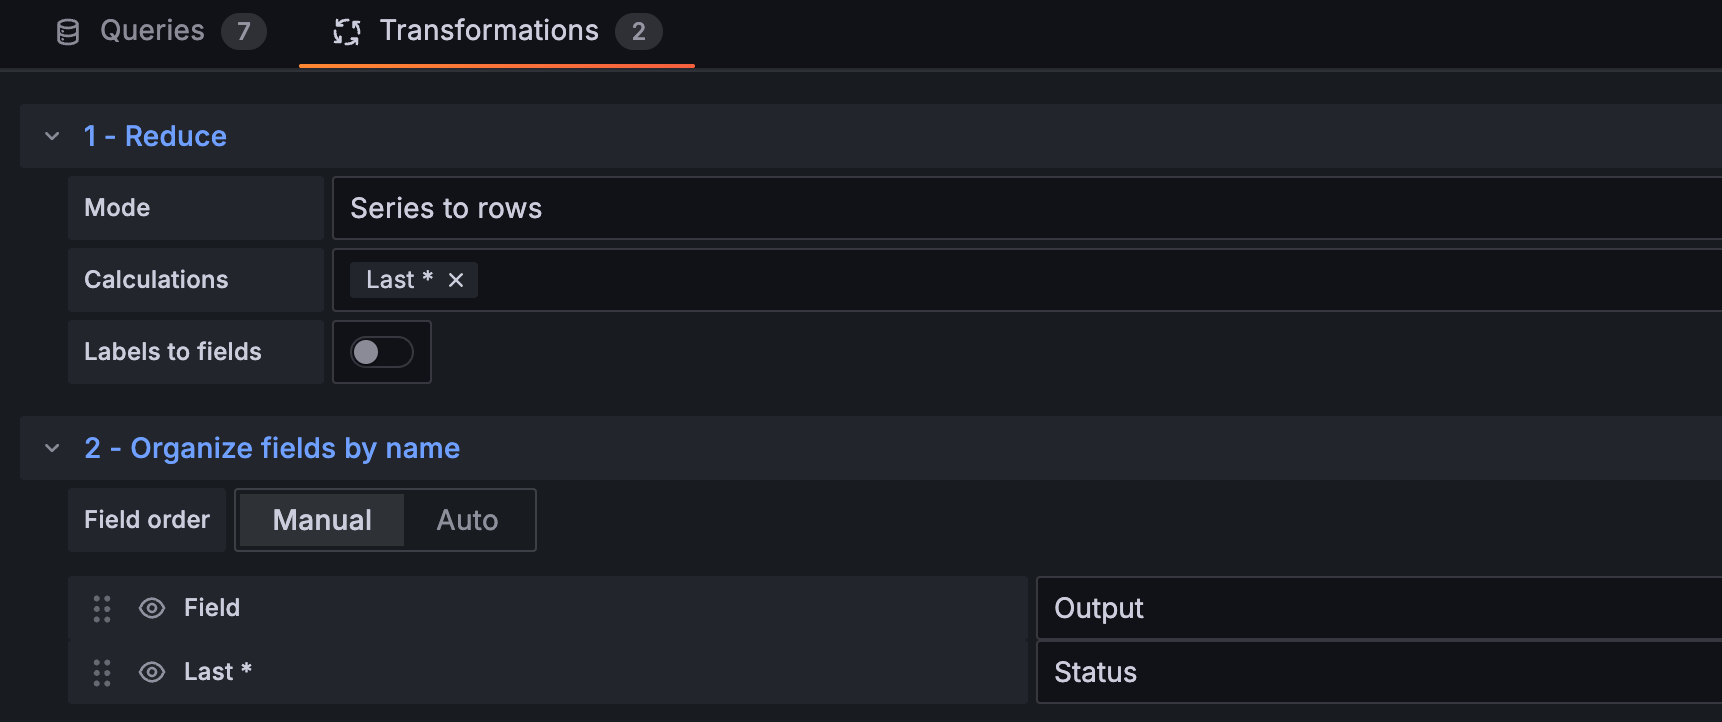
If we just left the table like that, you would have a row for each time the data was collected where column A is time and column B is the value. What we really want is a single row where column A is the name of the data and column B is the last known good value. To do this, we need to convert the data from many to 1.
Next to your query, select Transformations and select the "Series to rows" mode with "Last *" as the calculation. For professionalism, I like to rename the column headers too. That requires another transformation using "Organize fields by name." See the definitions below:
The last part to configure is the value mappings from the database to the visual. I have added both the integer and the text version of these value mappings below. Use whichever method you decided to go with.
In the end, here is what a full dashboard might look like with all the data points.
Calculated items
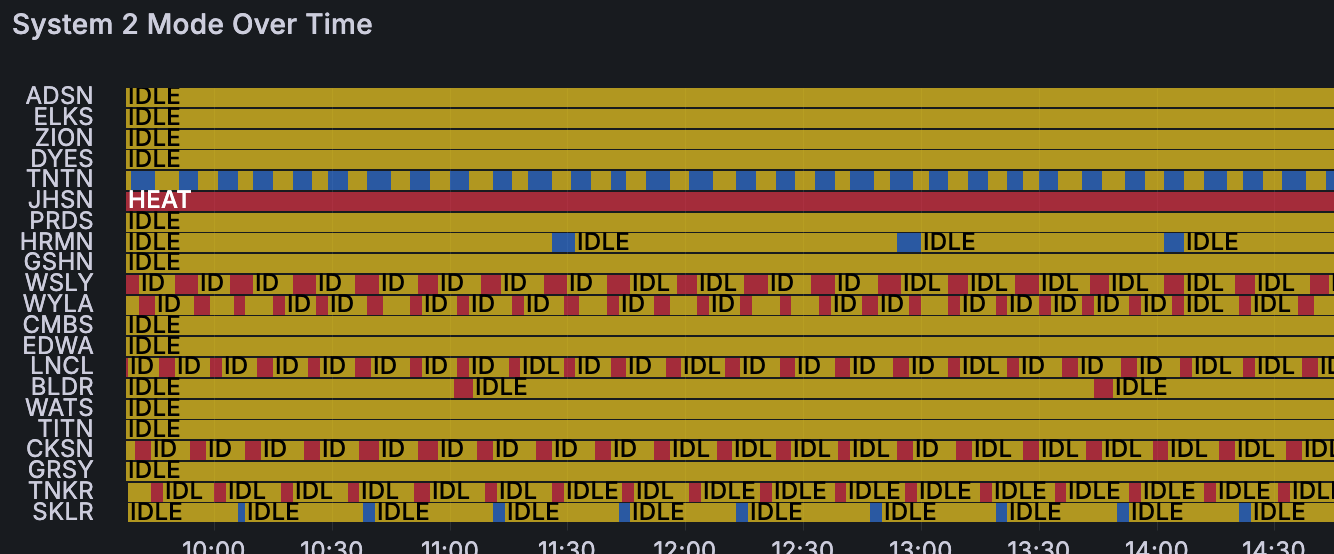
You may notice that we didn't talk through the "System 1 Mode" item. In order to get this data, you will need to create calculated item where you build logic to determine if the unit is heating. Here is the algorithm I am using
(last(//hvac.sys1.cooling_stage1_y1)>0 or last(//hvac.sys1.cooling_stage2_y2)>0 )
+ 2 * ( last(//hvac.sys1.heating_w)>0 ) * (1 - ( last(//hvac.sys1.cooling_stage1_y1)>0 or last(//hvac.sys1.cooling_stage2_y2)>0 ))
Algorithm for determining if unit is heating or cooling
Here is an example of what thats looks like over time:
Conclusion
By combining Zabbix master and dependent items with a lightweight Python integration, you can keeps polling efficient while still providing high-resolution insight into HVAC system behavior.
The same pattern can be extended to additional controllers, components, or even entirely different systems that expose structured or semi-structured data. With Grafana handling visualization and Zabbix managing collection and storage, the result is a monitoring stack that’s both scalable and easy to operate.
Additionally, the devices you interact with don't need to expose SNMP or APIs, if you can see the data, you can usually automate it.
The full implementation and diagrams are available on GitHub for reference and adaptation.